|
|
|
| |
|
|
| |
|
|
|
|
|
|
|
|
|
|
|
|
|
|
|
|
|
|
|
|
|
|
|
| |
|
|
| |
|
|
| |
|
|
| |
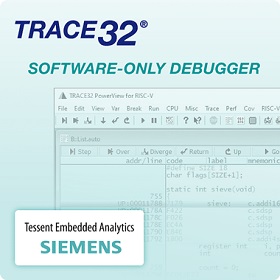
Lauterbach provides in addition to its
hardware-based
debug and trace tools pure software debuggers. These
debuggers are used to debug RTL simulations /
emulations
and virtual targets in the presilicon phase of a
project, and - relatively new - to debug the target
via
native host interfaces such as USB.
TRACE32 Software-Only Products are licensed via
TRACE32
Floating Licenses.
|
|
| |
|
|
| |
- Virtual Targets
- XCP
- USB and Intel DCI.DbC
- USB and Tessent Embedded Analytics
- TRACE32 Simulators
|
|
|
| |
|
|
| |
|
|
| |
|
|
|
|
|
| |
|
|
| |
|
|
| |
|
|
| |
TRACE32 Front-End
|
|
| |
- Front-end to third-party virtual
targets
- Front-end to third-party core
simulators
- Front-end to third-party target
servers
- Front-end to TRACE32 Back-End
- Same GUI as TRACE32 hardware
debuggers
- Debug features as provided by
third-party software/TRACE32
Back-End
- Trace features as provided by
third-party software/TRACE32
Back-End
- Windows, Linux and MacOSX
- Reprise RLM floating licenses
|
|
|
|
|
| |
|
|
| |
|
|
| |
|
|
|
|
|
| |
|
|
| |
|
|
| |
|
|
| |
Debugging via XCP
|
|
| |
 |
|
- Communicates with the target CPU via
XCP slave
- Supports "Software Debugging
over XCP" protocol specified by
ASAM e.V. as well as the
ETAS-specific debugging protocol
- Almost the same debug feature as
TRACE32 hardware-based debugger
- C/C++ debugging
- FLASH programming
- Access to all peripheral devices
- Multicore debugging
- Autosar-OS aware debugging
- Benchmark counters
- Cache debugging
- Debugging of all auxiliary
controllers
- Multicore tracing via on-chip trace
- Support for GTM, MPC5xxx, RH850,
TriCore
|
|
|
| |
|
|
| |
|
|
| |
|
|
|
|
|
| |
|
|
| |
|
|
| |
|
|
| |
Debugging via USB and Intel
Direct Connect Interface (Intel DCI) DbC
|
|
| |
- Stop-mode debugging for form factor
devices
- Stop-mode debugging via USB protocol
stack
- Standard JTAG is wrapped into DCI
packets
- SMP debugging (including
hyperthreading)
- AMP debugging with other
architectures
- BIOS/UEFI debugging with tailor-made
GUI for all UEFI phases
- Linux- and Windows-aware debugging
- Support for Intel x86/x64, ARC,
M8051EW, Xtensa
|
|
|
|
|
| |
|
|
| |
|
|
| |
|
|
|
|
|
| |
|
|
| |
|
|
| |
|
|
| |
Debugging via USB with Tessent Embedded
Analytics
|
|
| |
|
|
- Tessent Embedded Analytics (formerly
UltraSoC)
- Full support for all IP blocks
needed for debugging and tracing
- Stop-mode debugging via USB stack
- Core trace and bus monitoring via
USB stack
- Support for BK5_32IMFC, E20, E21,
E24, E31, E34, E76, FU540-C000,
LC130, LC130S-R0, LC131-R0, N25,
NX25, SCR1, SCR3
|
|
|
| |
|
|
| |
|
|
| |
|
|
|
|
|
| |
|
|
| |
|
|
| |
|
|
| |
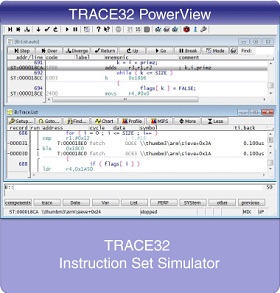
TRACE32 Instruction Set Simulators
|
|
| |
- Integral part of TRACE32
- Configurable as system under debug
(PBI=SIM)
- Allows post-mortem debugging
- Tool Qualification Support-Kit
(TQSK) available for TriCore
architecture
- Software compatible to all TRACE32
tools
- OS-aware debugging
- Cache simulation (architecture
dependent)
- Program and data flow trace based on
a bus trace protocol
- Advanced trace analysis features
Powerful script language
- Programming interface for peripheral
simulation
- Not available for processor
architectures that support
user-defined instructions
|
|
|
|
|
| |
|
|
| |
|
|
| |
|
|