| |
|
|
| |
|
|
| |
|
|
| |
|
|
| |
J-Trace PRO |
|
| |
|
|
| |

|
J-Trace PRO is SEGGER's "all-in-one" streaming trace probe for any popular CPU core and architecture. It combines all the debug capabilities of the market-leading J-Link with the analyzing, verifying and code-profiling features of the J-Trace for Arm- and RISC-V-based architectures.
|
|
|
| |
|
|
| |
|
|
| |
|
|
|
|
|
| |
|
|
| |
J-Trace PRO Cortex |
|
| |
|
|
| |
|
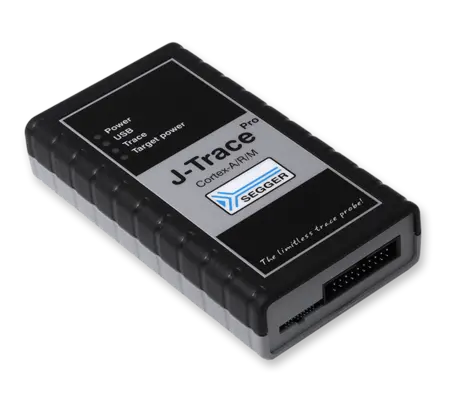
J-Trace PRO for Cortex-A/R/M-based microcontrollers supports tracing on a wide range of Arm Cortex cores.
SEGGER's J-Trace PRO can capture complete traces over long periods - thereby enabling the recording of infrequent, hard-to-reproduce bugs. This is particularly helpful when the program flow 'runs off the rails' and stops in a fault state.
|
|
|
| |
|
|
| |
|
|
| |
|
|
|
|
|
| |
|
|
| |
J-Trace PRO Cortex-M |
|
| |
|
|
| |

|
J-Trace PRO for Cortex-M-based microcontrollers enables continuous streaming trace for code development and optimization.SEGGER's J-Trace PRO can capture complete traces over long periods - thereby enabling the recording of infrequent, hard-to-reproduce bugs. This is particularly helpful when the program flow 'runs off the rails' and stops in a fault state.
|
|
|
| |
|
|
| |
|
|
| |
|
|
|
|
|
| |
|
|
| |
J-Trace PRO RISC-V |
|
| |
|
|
| |
|
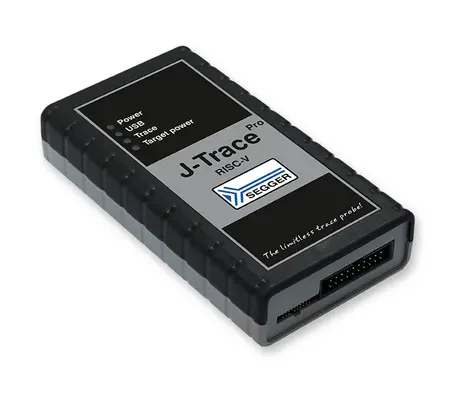
J-Trace PRO for RISC-V-based microcontrollers supports tracing on a wide range of RISC-V cores. The J-Trace PRO RISC-V provides support for RISC-V-based microcontrollers. With its superspeed USB 3.0 interface, J-Trace PRO RISC-V enables continuous streaming trace via USB with full trace clock. It enables a far-reaching and complete analysis, offering fast and efficient data analysis, ensuring higher productivity while also lowering development risks and costs.
|
|
|
| |
|
|
| |
|
|
| |
|
|
|
|
|
| |
|
|
| |
J-Link PRO PoE |
|
| |
|
|
| |

|
J-Link PRO PoE is SEGGER's specialized programming and debug probe for creating test farms. It can draw power via Ethernet and supplies power to the target either via debug interface or a USB A connector.
|
|
|
| |
|
|
| |
|
|
| |
|
|
|
|
|
| |
|
|
| |
J-Link PRO |
|
| |
|
|
| |

|
J-Link PRO is SEGGER's versatile JTAG/SWD programming and debug probe with USB and Ethernet interfaces. J-Link PRO is fully compatible with J-Link and can be used "out-of-the-box". J-Link PRO uses DHCP per default. The built-in web server makes manual configuration easy. Ethernet allows the use of the debug probe far away from the PC, over a hardwired or wireless network, in a development or production
|
|
|
| |
|
|
| |
|
|
| |
|
|
|
|
|
| |
|
|
| |
J-Link ULTRA |
|
| |
|
|
| |
|
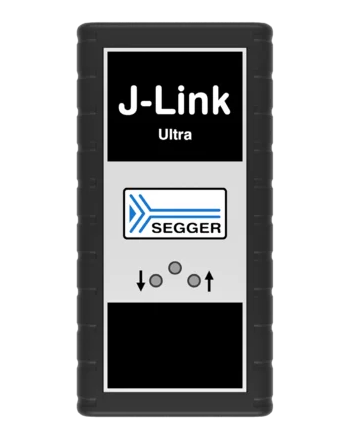
J-Link ULTRA is a JTAG/SWD debug probe designed for Arm/Cortex. It is fully compatible to the standard J-Link and works with the same PC software.
Based on the highly optimized and proven J-Link, it offers even higher speed as well as target power measurement capabilities due to the faster CPU, built-in FPGA and high-speed USB interface.
|
|
|
| |
|
|
| |
|
|
| |
|
|
|
|
|
| |
|
|
| |
J-Link WiFi |
|
| |
|
|
| |
|
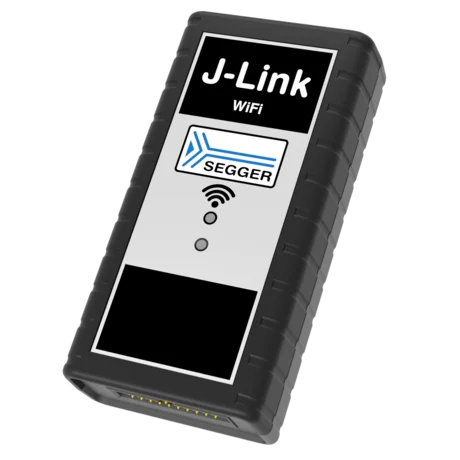
J-Link WiFi is a JTAG/SWD debug probe with WLAN/WiFi interface. It can communicate at high speed (up to 15MHz) with the supported target CPUs. If a wireless debug interface is required, J-Link WiFi is the perfect solution. J-Link WiFi is the wireless option, when the targeted embedded device is moving or must be shielded from the environment. It is USB powered, so that it can use the same power source as the target device. It can communicate at high speed with the supported target CPUs.
|
|
|
| |
|
|
| |
|
|
| |
|
|
|
|
|
| |
|
|
| |
J-Link PLUS |
|
| |
|
|
| |
|
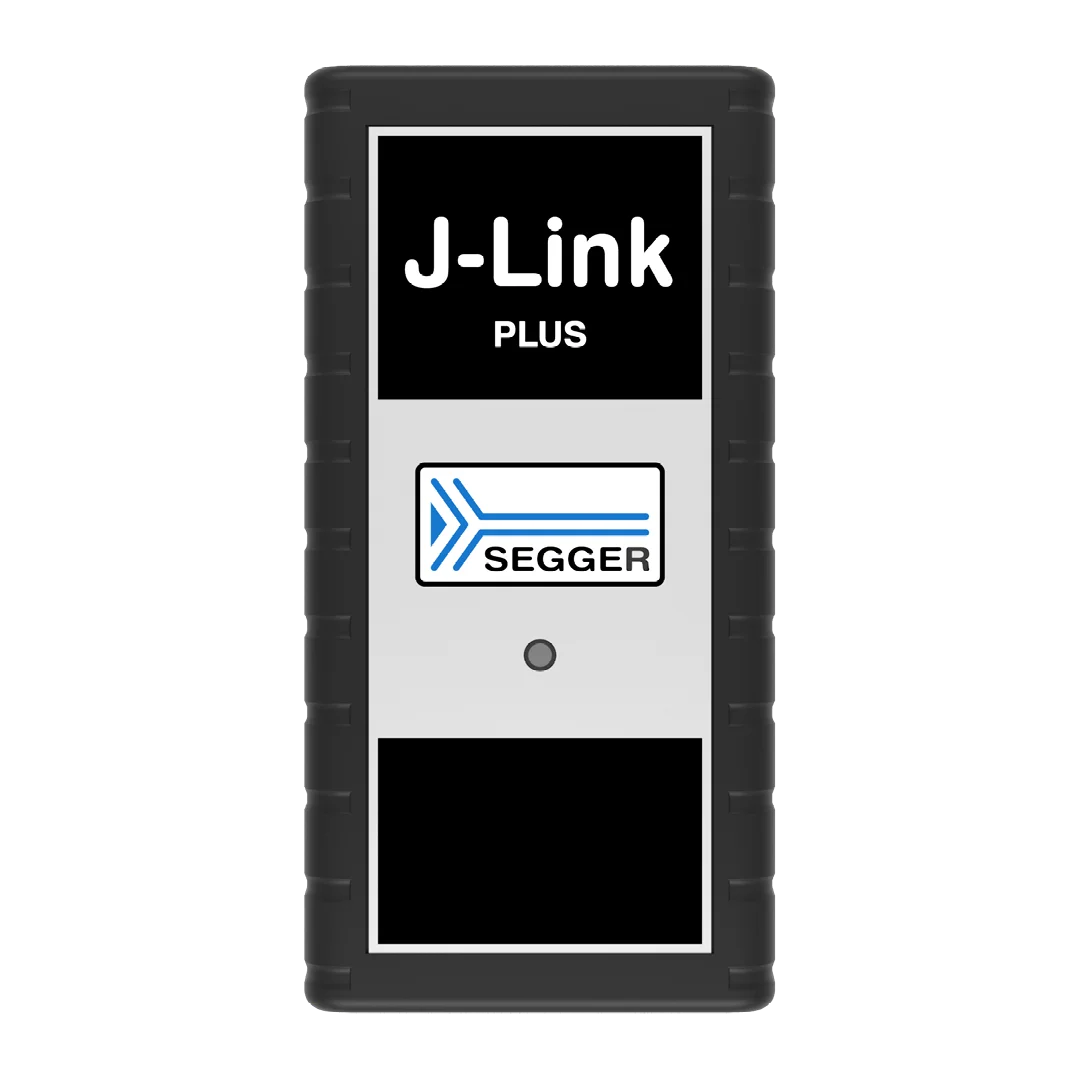
Based on a 32-bit RISC CPU, SEGGER's J-Link PLUS can communicate at high speed with the supported target CPUs.
J-Link PLUS is available in two form factors with identical function: J-Link PLUS Classic and J-Link PLUS Compact.
|
|
|
| |
|
|
| |
|
|
| |
|
|
|
|
|
| |
|
|
| |
J-Link BASE |
|
| |
|
|
| |
|
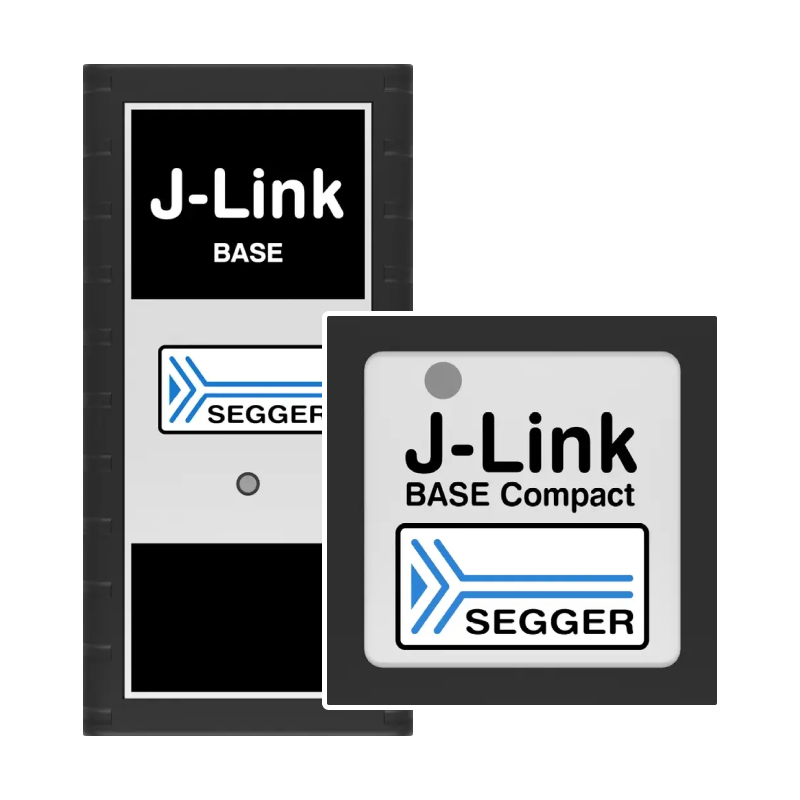
The J-Link Base is the perfect level for the average developer to jump into the wide world of J-Link.
All J-Links feature high-speed programming (from 1 MB/s up to 4 MB/s), built-in VCOM functionality, and support for a broad range of microcontrollers. Plus, all future software and firmware updates, as well as any new flash loaders for target devices that will be added, are free of charge. And all J-Link debug probes are supported by all major IDEs including Eclipse, GDB-based IDEs and SEGGER Embedded Studio.
|
|
|
| |
|
|
| |
|
|
| |
|
|
|
|
|
| |
|
|
| |
J-Link EDU Mini |
|
| |
|
|
| |

|
The J-Link EDU Mini is a minimalistic version of the J-Link debug probe in a reduced form factor with identical functionality. It is designed for educational purposes and supports Arm and RISC-V based microcontrollers. SEGGER Embedded Studio.
|
|
|
| |
|
|
| |
|
|
| |
|
|
|
|
|
| |
|
|
| |
J-Link OB |
|
| |
|
|
| |

|
With SEGGER's J-Link OB, the full functionality of a J-Link debug probe can easily be added into target board designs for various use cases, such as production test setups, internal development boards, evaluation kits, or even built in to shipping commercial products for in-field debugging or firmware updates.
|
|
|
| |
|
|
| |
|
|
| |
|
|
|
|
|
| |
|
|
| |
J-Link SWD Isolator V2 |
|
| |
|
|
| |

|
|
Specification |
Value
|
|
Basic isolation |
1kV DC |
|
Supported target operation
voltage |
1.2V ... 5V |
|
Target side current consumption |
< 25�A |
|
Supported SWD speed |
Max. 4 MHz |
|
Emulator side |
20-pin 0.1" male connector |
|
Target side |
20-pin 0.1" male
connector |
|
|
|
| |
|
|
| |
|
|
| |
|
|
| |
|
|